

Junger Loudness Logger License for J*AM Software
Contact us
Availability:
Electronic DownloadThis item is an electronic download. Please contact our sales team to purchase.
Description
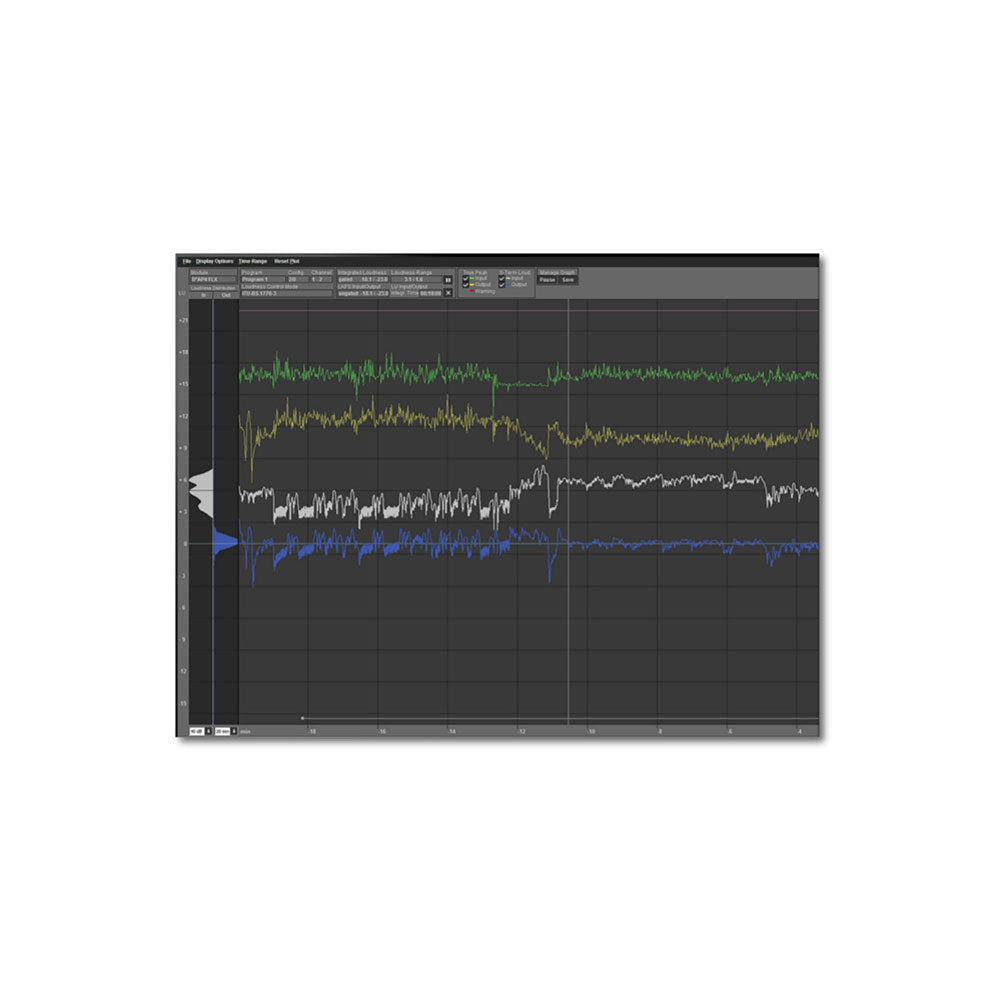
An array of extra features and functionality can be accessed through the addition of the Loudness Logger™ license option. Administered by the use of a USB dongle, a separate window can be opened which displays a live plot of short-term loudness and true peak input/output values. A loudness distribution graph also shows the evolution of pre-treated compared to post-treated signals over time. The license also allows for logging of measured data from all channels of each connected device to a folder location anywhere on the network. The frequency and duration of the log files can be easily customized.
The log files themselves are stored in csv format but to aid future interpretation, a comprehensive log file analyzer tool is included. This opens the selected log file and rebuilds the stored data into its original graphical plot format. The date and time stamp makes it simple to look back any specific point within the file. A zoom function allows very precise analysis of the selected region whilst a log file comparator can display two plots simultaneously to allow a side by side direct comparison.
Your home for all things pro audio—backed by expertise and experience. Connect with us today.
Your home for all things pro audio—backed by expertise and experience. Connect with us today.